One report for every channel and every product.
pirio is the reporting layer on top of your own BigQuery. Ad spend, web analytics and app data are matched overnight, and the reports below read from those tables every morning.
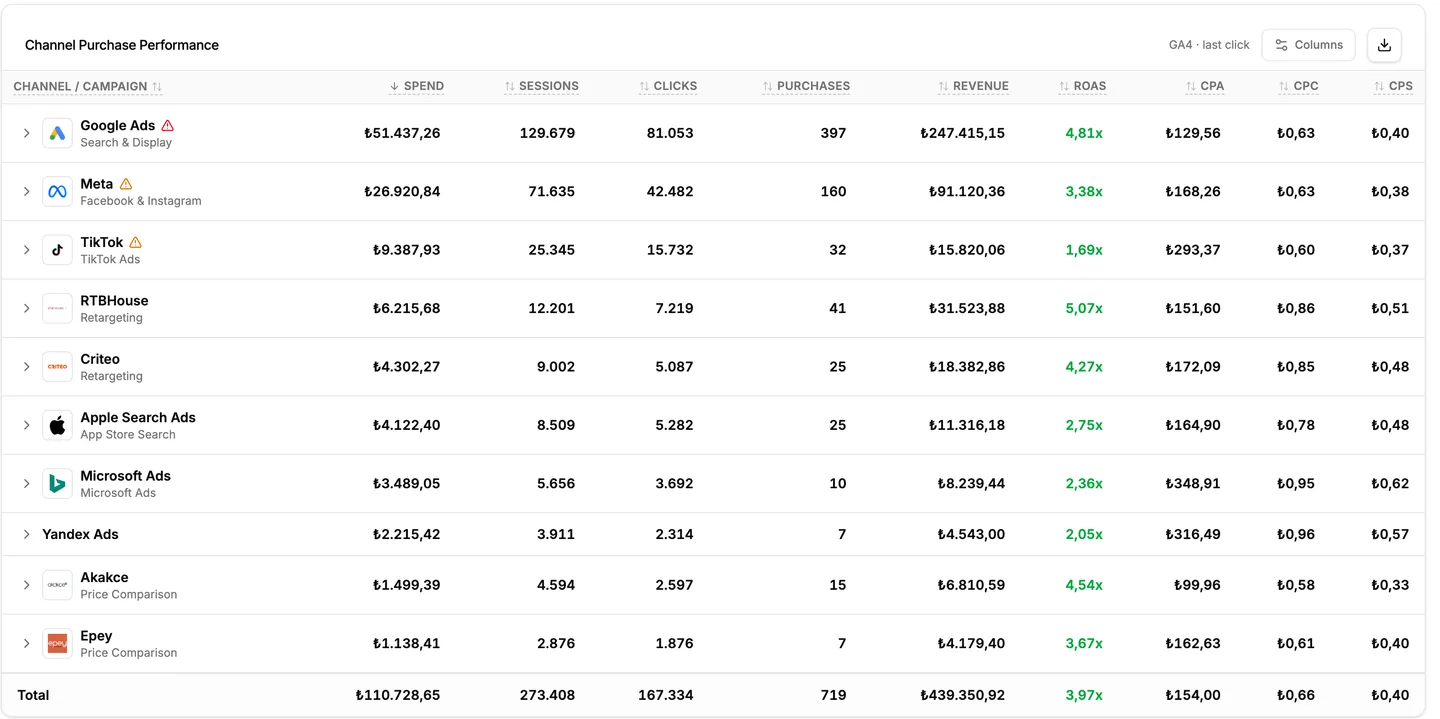
Every channel on one line, judged by the same revenue.
Spend, clicks, purchases and revenue per channel and campaign. ROAS, CPA and CPC are calculated against your own purchase data, not against what each platform reports about itself.
- Channel and campaign drill-down with the same columns everywhere
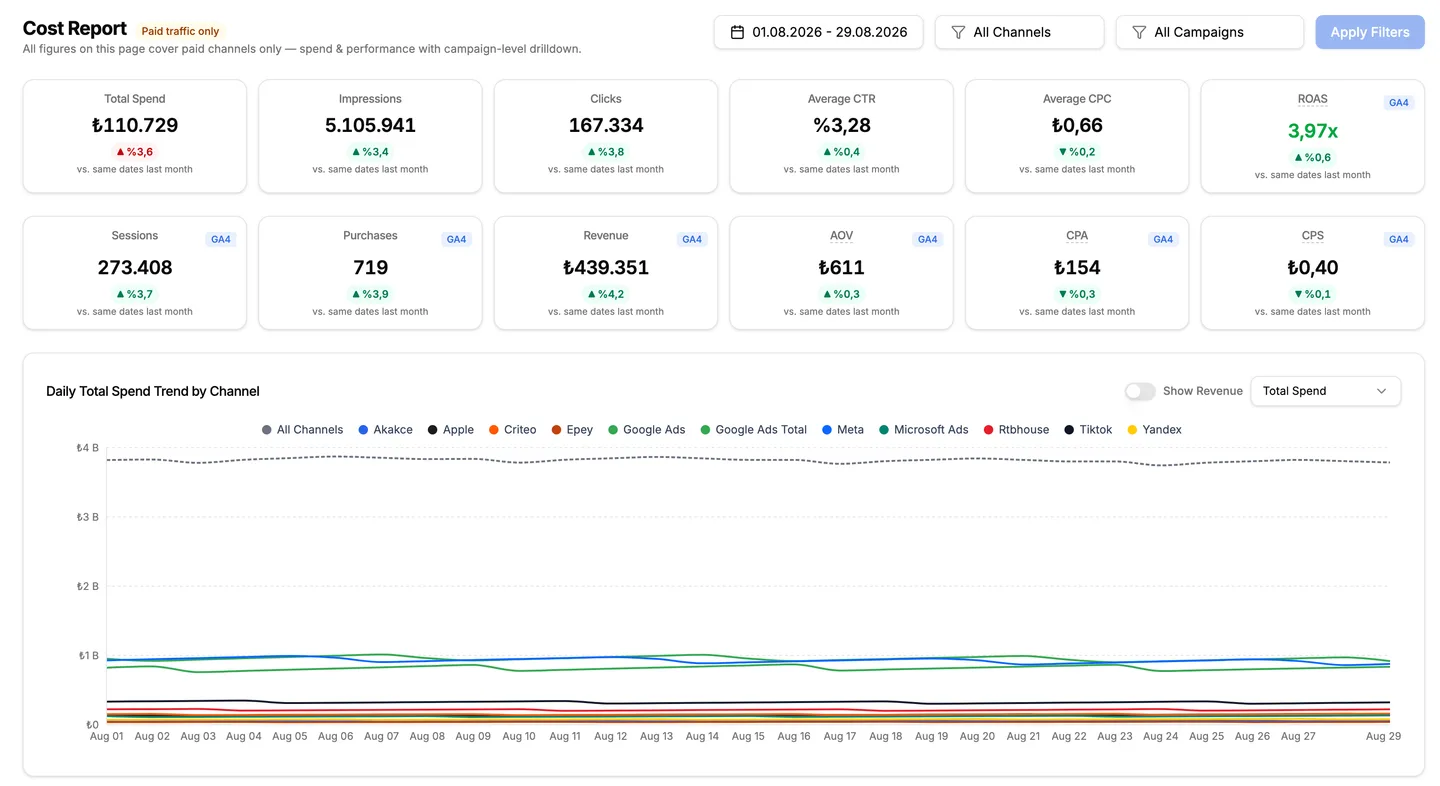
- Month-over-month change on every metric
- Daily trend by channel, spend and revenue on one chart
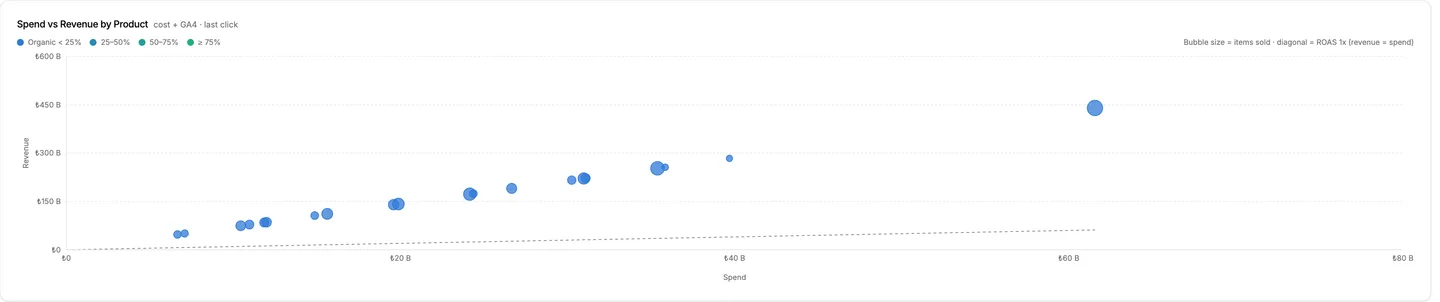
Which products your paid traffic actually bought.
Revenue, purchases and paid share per product and category, built by matching your cost tables to item-level purchase events. The question “what did that spend sell?” gets a table instead of a guess.
- Product and category performance for paid vs. organic traffic
- Top movers: what gained and what lost this period
- Feed-ready view for catalog and campaign decisions
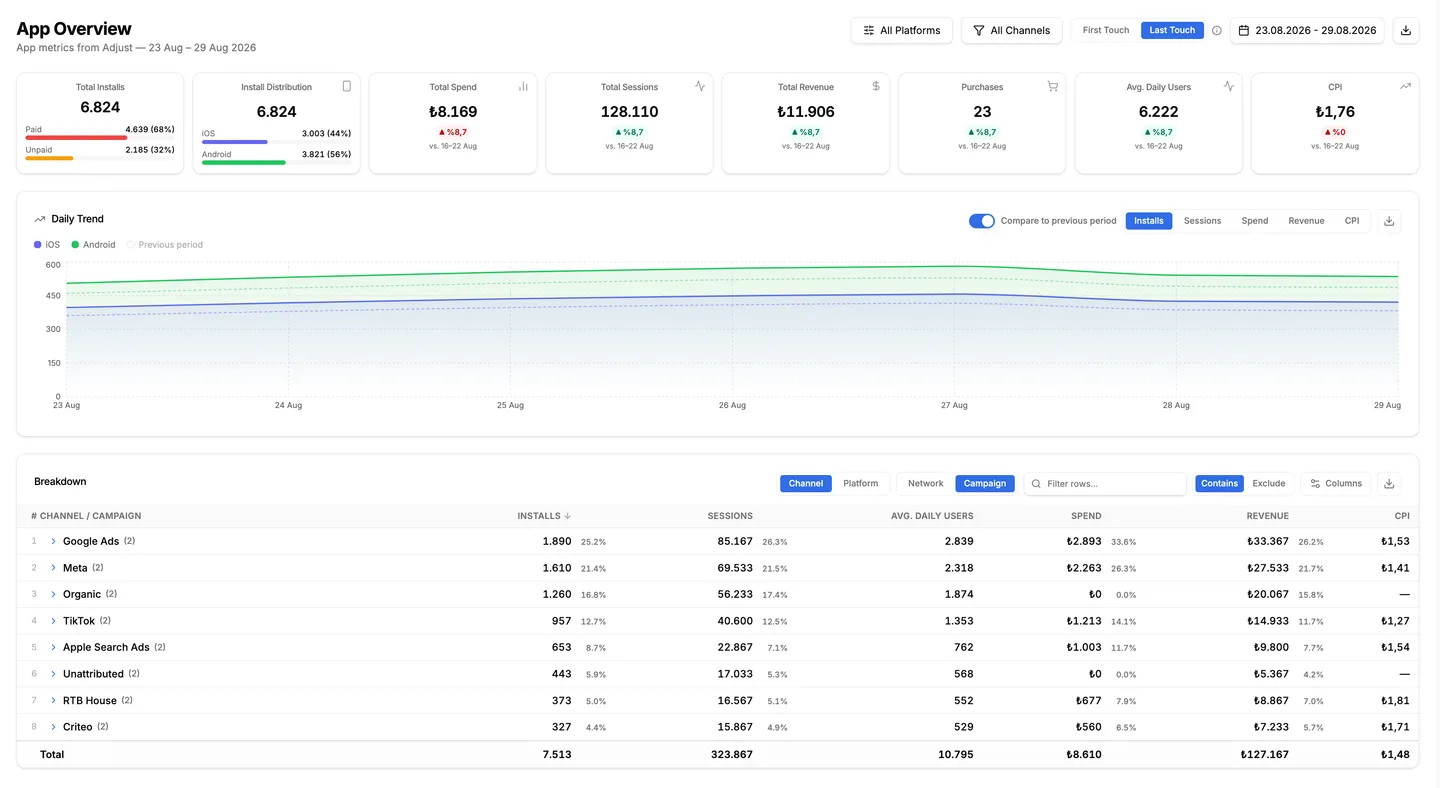
Installs and cohorts next to your web numbers.
Adjust data lands in the same project as your ad spend and web analytics. Paid and organic installs, CPI, retention and revenue cohorts read from one place, on the same dates as everything else.
- Paid vs. organic install split with cost per install
- Day 7 and monthly retention and revenue cohorts
- First-touch or last-touch attribution, switchable
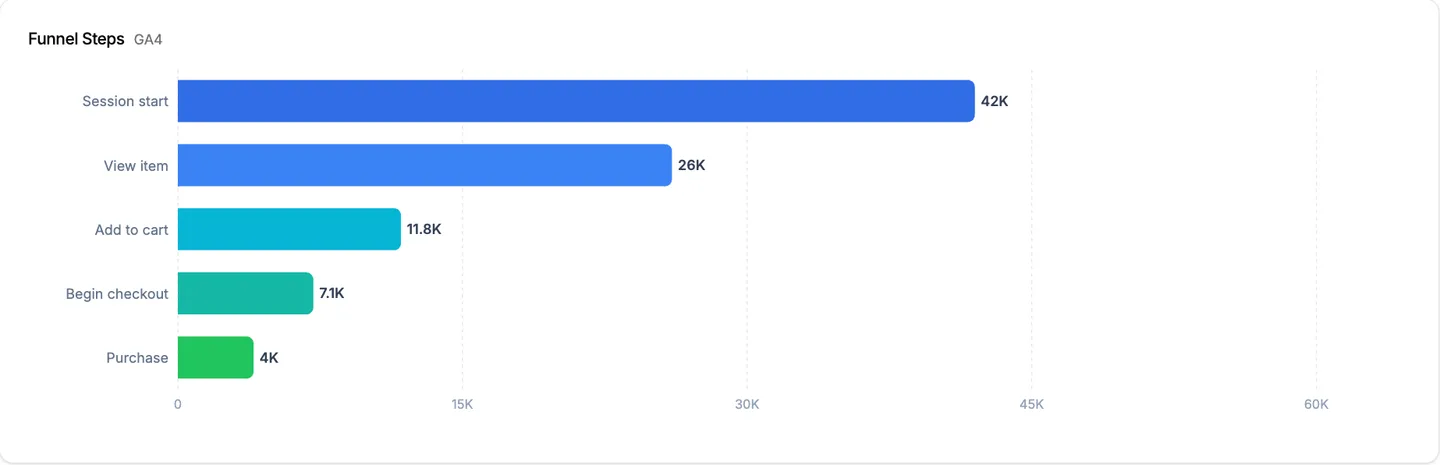
From session to purchase, step by step, per channel.
Define the steps once (view item, add to cart, begin checkout, purchase, or your own events) and see where each channel’s traffic drops out. Built on your GA4 export, so the steps are the real events, not modelled ones.
- Configurable steps saved per project
- Acquisition view: funnel by channel and campaign
- Dry-run the query before saving a new funnel
Cross-sell and customer journey, from the same tables.
Which products are bought together, and which sequence of channels a buyer touched before purchase. Two prebuilt analyses that answer questions a channel table cannot.
- Cross-sell: product pairs and baskets
- Customer journey: channel sequences before purchase
- Same date filters as every other report
Orders and products from Shopify, next to the ads that sold them.
For Shopify stores, orders, products and customers are synced into your project and reported alongside spend. Shown only when a Shopify connection exists.
- Orders, products and customers synced nightly
- Store report with the same channel definitions
- Feeds product-level revenue where GA4 item data is thin
The monthly app deck, generated.
Installs, cost, cohorts, Apple Search Ads campaigns and monthly signup trend in one report, with a PowerPoint export that matches the page. Built for the meeting, not just the dashboard.
- Monthly signup and install trend
- Cohort conversion and retention
- One-click PPTX export
The surprise shows up as a flag, the same day.
Every morning pirio compares each channel against its own recent pattern. A spend jump, a revenue drop or a channel that stopped reporting appears in one list, with the numbers that triggered it.
- Per-channel spend and revenue checks, daily
- One list across all channels and projects
- Silent connector failures caught before the report is wrong
Every report reads from tables in your project.
Nothing is copied into a pirio database. The same tables that power these reports stay in your Google Cloud, in your account, under your permissions.
Every stack gets its own setup.
Standard connectors, custom pipelines, or both. Tell us what you’re running and we’ll come back with a plan and a price.